Description

Ever found yourself ploughing through thousands of logmessages, getting loss of track. TailExpert can save you precious time. Use filters and highlighting to increase readability, save or print filtered logs for reporting, choose one of the predefined formats or create your own format to columnize log messages for better readability.

Columnize 
You can view your log messages as lines of text bu when you create a format for your logs the real power of TailExpert gets unleashed.


Import wizard
Use the import to help you configure the format of your logs. You can build a format using simple splitting rules or complex regular expressions to match your log lines. Configure the timestamp of date/time columns and log severity column if present and TailExpert will be able to provide additional features that can help you analyze your logs.
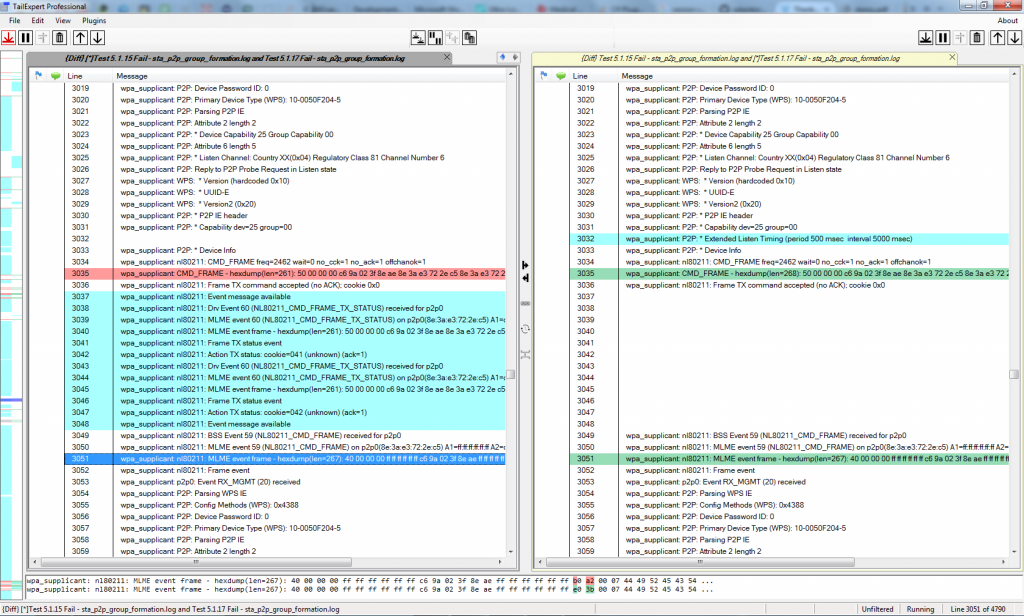
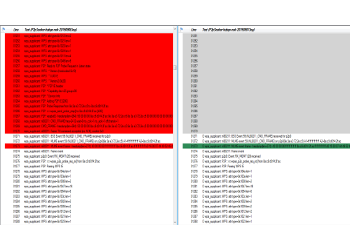
   

Filter

Use the built-in filter tool to view only log messages of your interest. The filter also supports Regular Expressions which can help even more to filter out only the required information.                     

Quickly switch between filters in the Treeview which can be exported/imported to build a quick access filter library, 
 

HighLight

Use the notification tool to colorize logs for better readability or use it to be notified when a log message matches a defined pattern. You can even run a script when a match is found.

Compare

No need for multiple tools TailExpert supports comparing logs with the built-in compare tool which makes it easy to find locate annomalies in consecutive logs.

Scroll-Lock Side by Side Logviews

Solve connectivity issues by viewing client and server logs side by side and sync the messages using   the timestamps. This view enables you to see the logs of both ends of your communication in a timeboxed view.

Graphs and Histograms

Plot values found in your logs or count the number of occurrences of some keywords in your logs and create histograms and pie charts instantly. Just point your mouse ate the value of interrest, ctrl-click the right mouse button and choose the plot or histogram option. TailExpert will analyze your complete log and create the graph for you. Double click the graph to zoom in and have the ability to print the graph.

Alerts
 
You can even run TailExpert for days and let it signal you when the log matches an expression. Don’t want to hang around waiting for issues to popup in your logs? TailExpert can send it to you via email when a match is made.

Log severity

When you setup the format for your log and configure the column where TailExpert can find the log severity (level), TailExpert will visualize these log severity levels using clearly visible icons and you will be able to select the severity levels you want to see by clicking on the level icons that become visible at the top of the screen. Even the behavior of these buttons can be altered in the preferences dialog. 


Customization

Write sophisticated log analysis scripts using lua scripting. The scripting engine even supports the use of .NET objects which make it possible to visualize statistics or graphs of values present in the logs. The software comes with a number of example scripts that can give you a quick start in creating lua scripts for TailExpert